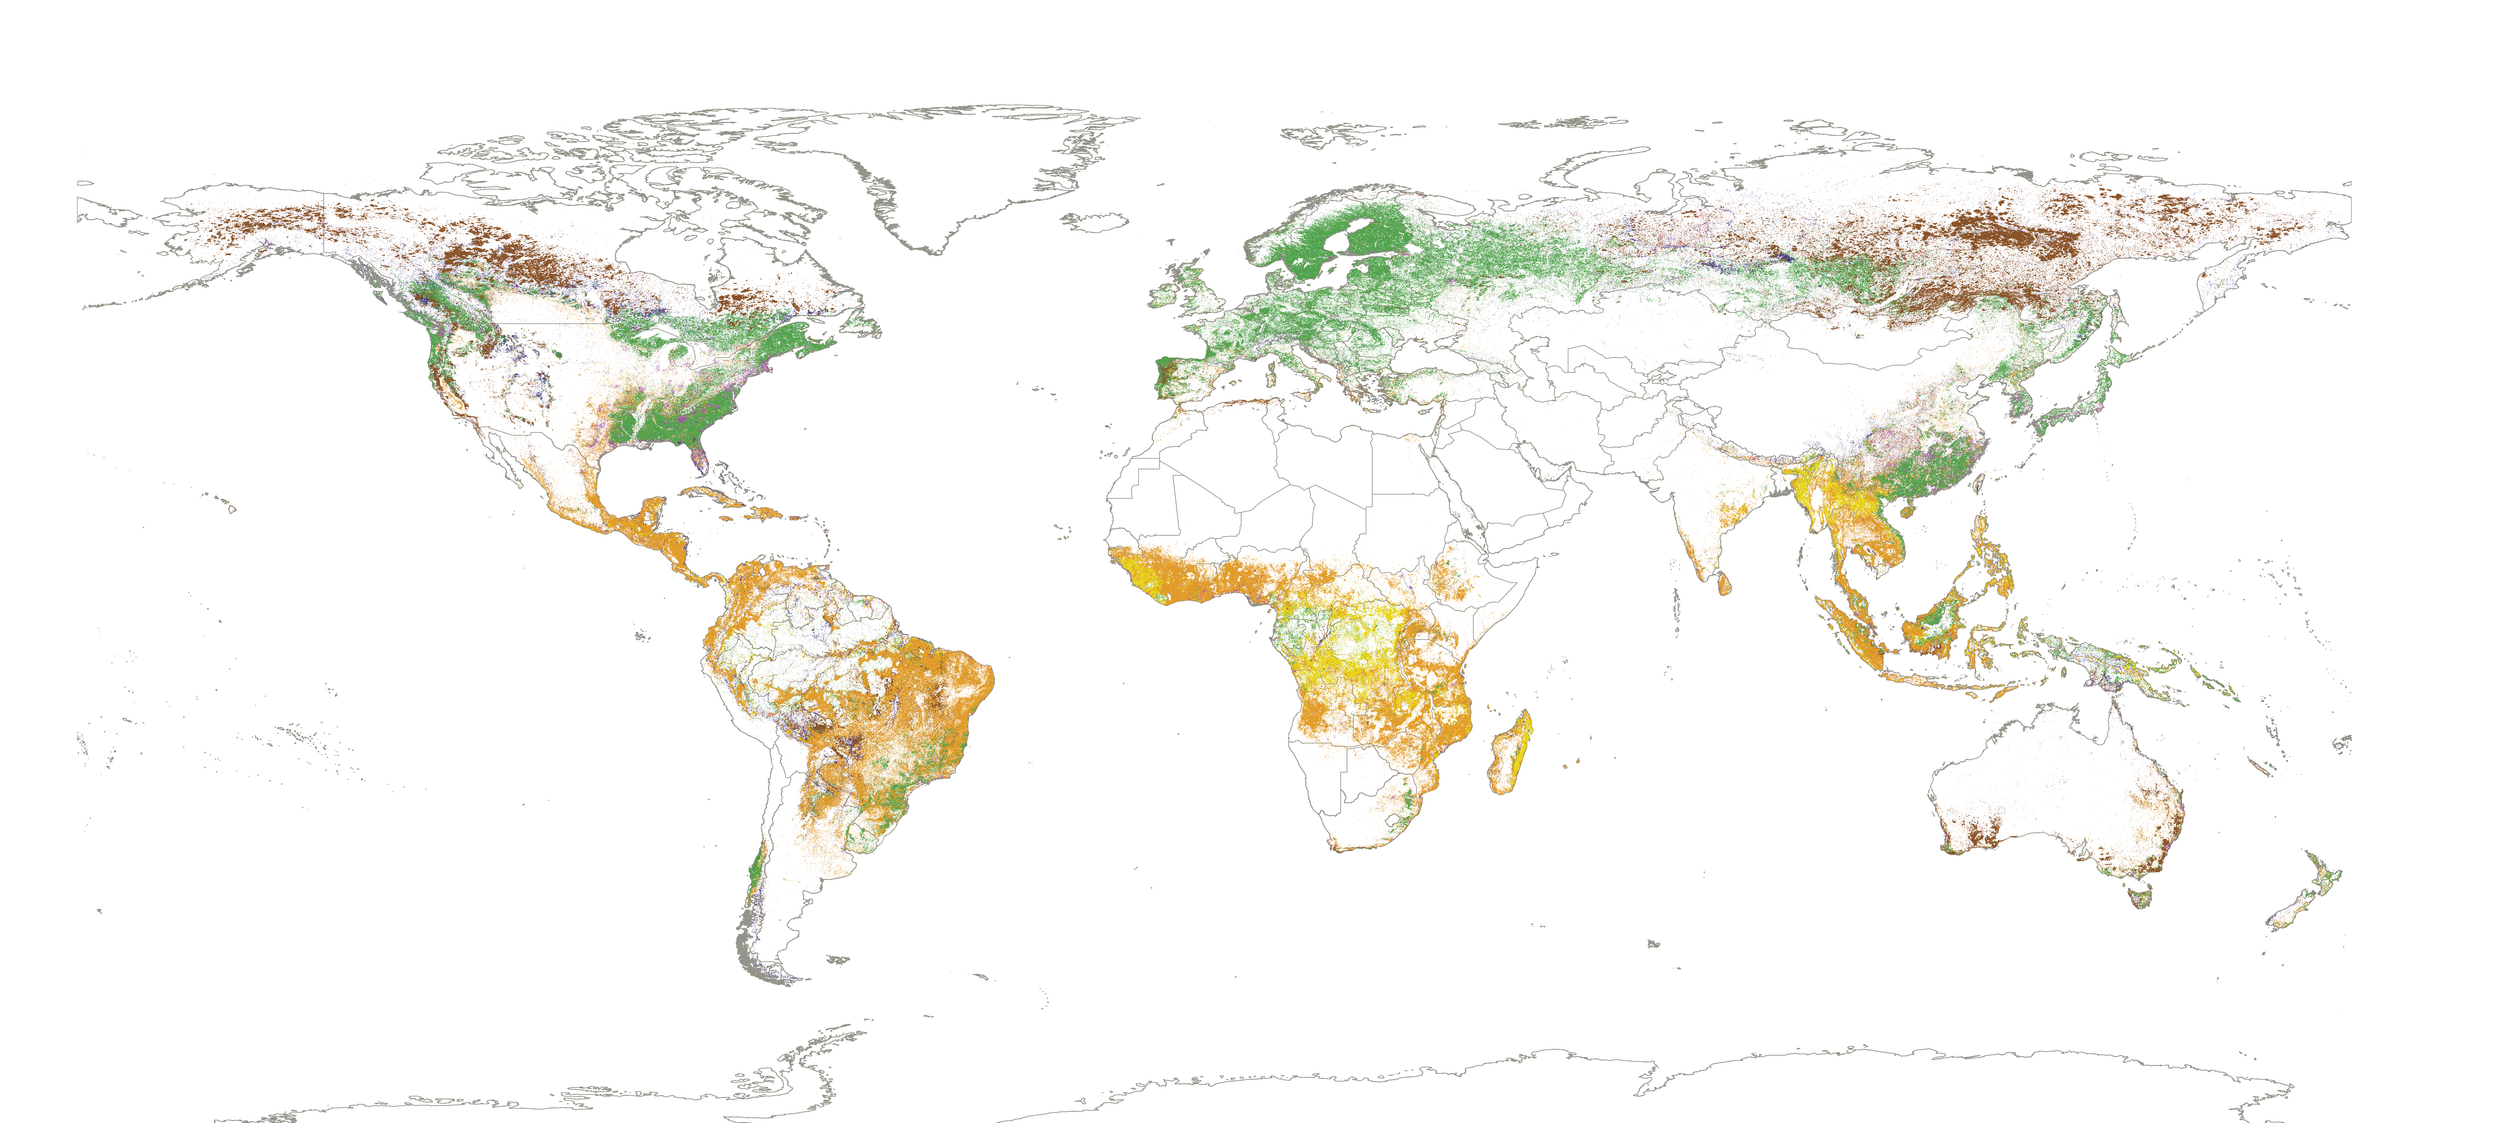
Drivers of Global Tree Cover Loss
-
Client
World Resources Institute
-
Tools
HTML, CSS, JS, Flourish, Illustrator
-
Role
Data Visualization Designer
The Format
Researchers at Land & Carbon Lab, Global Forest Watch (GFW), and Google DeepMind developed a new dataset that maps the dominant drivers of forest loss at 1 kilometer resolution from 2001-2025, giving researchers the most detailed view yet of what is causing global forest loss.
I helped the researchers develop the visuals to accompany their findings on WRI’s flagship Insights blog. Inspired by the unprecedented level of detail of the new map, I created a scrollytelly using the raster map tile they generated to pan around to different regions and zoom into specific examples that we paired with satellite timelapses, allowing readers to see how the data layer captured the physical land changes.
We were also lucky enough to have this data available at the country level, so I created a “data explorer” tool at the end that would allow readers to look up the drivers of tree cover loss in their country and compare it to others.
Early Sketches for Social Media
The colors of the drivers classes feature very prominently in the blog, which inspired me to create a color-block carrousel that walks the reader through each driver one by one. I also used the global drivers numbers to create a sneaky bar chart on the first slide that gently introduces readers to the drivers colors and global proportions.